At Quo, the Temporal Workflow Engine powers many of our internal services. We previously shared how we built our voice agent with Temporal. We’ve had many similar success stories since that project.
We host Temporal ourselves. Aurora PostgreSQL is the storage layer supporting it. Postgres has taken us further than we expected. Recently, however, our workloads outgrew it, and we started a move to Cassandra. This is what we learned on the way.
Why we self-host
Temporal Cloud is good for getting started with your workflows. At a certain volume, however, its per-action pricing becomes prohibitive. With self-hosting, you trade a financial burden for an operational one. You run your own clusters, monitor your own dashboards, and page your team when something goes sideways.
That trade off has become worth it for us. We already run a sizable EKS footprint, and our SRE muscle is tuned for it. The workloads we run on Temporal are core to the product. We want access to every dial, which is why we switched to a self-hosted solution on Aurora.
How Temporal hits a database
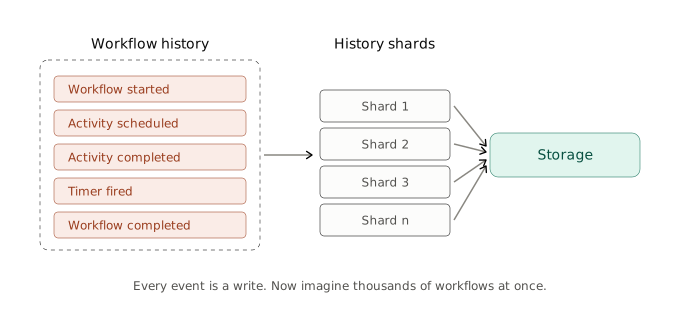
Temporal’s whole purpose is to make workflow execution durable. Every event in a workflow’s life — start, signal, activity scheduled, activity completed, timer fired, completion — is appended to a history. That history lives in the database. Every event is a write event.
The unit of throughput in the Temporal ecosystem is state transitions per second. Roughly: how many of those event-writes the cluster absorbs. Storage size matters, but it’s almost never the barrier. Write throughput is the real bottleneck.
Temporal shards its history internally. This is represented by numHistoryShards, fixed at cluster creation. The database’s job is to absorb the per-shard writes as fast as Temporal can produce them. Think of every workflow as a journal that has to fsync every paragraph it writes, and the database as the journal store. Now imagine thousands of them at once.
Squeezing more from Aurora
Before we considered switching to Cassandra, we wanted to push Aurora as much as we could. How much more could we get from Aurora before changing anything fundamental? We learned a significant amount by asking this question. Postgres’s defaults are tuned for general-purpose workloads on hardware that mostly doesn’t exist anymore. Temporal’s workload isn’t general-purpose. So we tuned it to our needs.
We focused on four key parameters:
1. synchronous_commit = off.
This is the parameter that makes seasoned DBAs flinch. By default, Postgres won’t acknowledge a COMMIT until the WAL record has been flushed to durable storage. If you turn it off, then Postgres acks earlier, which batches the actual flush. You get a much higher commit rate at the cost of possibly losing the last few hundred milliseconds of writes if the writer crashes at exactly the wrong moment.
For most workloads, that’s a hard no. For Temporal on Aurora, it’s a defensible trade. Here are two reasons why:
- “WAL” is distributed storage. In Aurora Postgres, the “WAL” isn’t a local file the writer fsyncs – it is the distributed storage layer (log-is-the-database). What synchronous_commit = off actually skips is waiting for the storage quorum to acknowledge before returning COMMIT. The data is still on its way to X copies across Y AZs; the writer just doesn’t block on the round trip. The loss window is small, bounded by the next group commit landing.
- Temporal’s workload absorbs that residual risk well. Activity scheduling, activity completion, and timer events are idempotent. If a dropped event causes Temporal to re-schedule an activity on replay, the activity’s idempotency handles it. Signals are a genuine edge case: a sender can be acked for a signal that doesn’t end up persisted. For our throughput goals, it’s a trade-off we accept knowingly, not one we wave away.
2. random_page_cost = 1.1.
The default random_page_cost value is 4.0. That number was chosen back when “random page” referred to physical disk head performance. Aurora storage doesn’t move heads. Random IO and sequential IO cost the same. Leaving the default at 4.0 makes the planner over-prefer sequential scans over indexed lookups. This is exactly the wrong instinct for Temporal because it knows precisely which row, in which shard, to access. Nudging it down to 1.1 matches the planner’s view of the world to the world. AWS’s own guidance for Aurora Postgres recommends the same value.
3. idle_in_transaction_session_timeout = 30s.
Temporal’s transactions are short. Anything sitting open and idle for thirty seconds is a stuck connection, holding locks and blocking vacuum. Killing those idle transactions is a safety net, not a behavior change.
4. autovacuum_vacuum_scale_factor = 0.06.
Temporal’s shard tables are insert-update-delete heavy, so dead tuples accumulate fast. Postgres’s default of 0.2 means autovacuum waits until roughly a fifth of the table is bloat before doing anything. Six percent runs vacuum more often in smaller bites. That means less bloat, more predictable latency.
None of these are exotic tactics. They’re all mentioned in the official documentation. What we learned is that they were all especially defensible for Temporal: short transactions, indexed reads, idempotent operations above the database, and high churn on a small set of tables. The usual caveats either don’t apply or are absorbed by Temporal’s design.
Hitting the limits of Aurora
As traffic kept growing, we split workflows into two clusters. We created a second Temporal cluster with its own Aurora instances, dedicated to our latency-sensitive “realtime” path.
Now, we had two clusters in two databases. It bought us time, but it didn’t change the scaling curve.
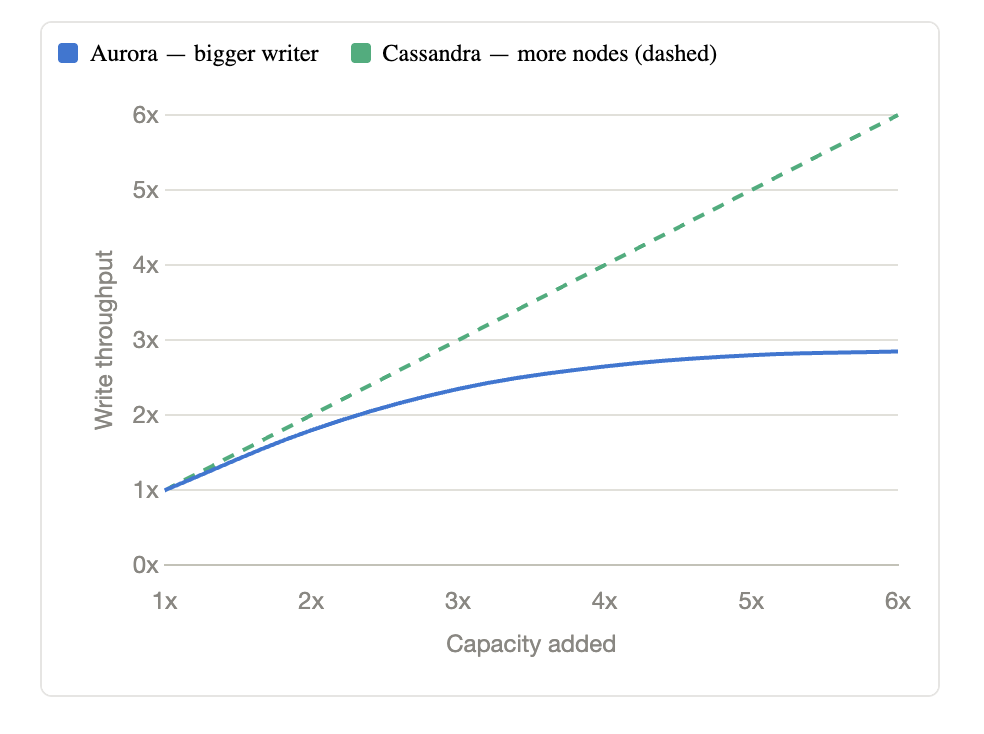
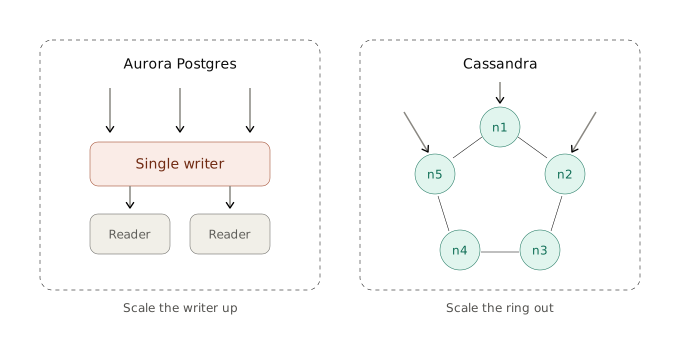
Aurora had one writer when we were using it. Aurora Limitless Database, which shards writes across nodes, came later. You can vertically scale that writer with a bigger instance, more vCPU, more memory, and more provisioned IOPS. But there’s a ceiling, and as our workflow volume kept climbing, we started to feel it. Persistence latency would creep up under bursts. Vacuum would fall behind during peaks. The Aurora storage cap was never our problem; we never came close to it. The problem was that one node could only absorb so many writes.
Once you go past the ceiling, the next concurrent writer doesn’t live on Aurora. It lives on a backend that was designed to be sharded.
Why we chose Cassandra
Cassandra is Temporal’s reference backend. It’s the one the core team tests against at scale and the one most large self-hosted deployments use. The reason is structural: Cassandra is sharded by design, is write-optimized, and scales horizontally. When you add a node, you add throughput.
The trade-off with Cassandra is flexibility. It can’t handle the kinds of ad-hoc queries that Postgres handles well. But Temporal doesn’t need ad-hoc queries; it knows exactly which key it wants in which keyspace. The match is unusually clean.
We’d tuned Postgres about as far as the standard configs would go and hit the single-writer wall. There were options to continue scaling, but they were at a rapidly increasing cost and complexity. At the same time a standard and supported alternate backend was sitting right there in the docs. The question wasn’t whether to move. It was how much Cassandra we needed.
What load testing Cassandra taught us
We stood up a Cassandra-backed Temporal cluster in our QA environment via the k8ssandra operator. We pointed Temporal’s own benchmark workers at it and scaled until something hurt. The goal was to track sustained state transitions per second. Based on that, we planned to create a sizing recipe to ship to production and beyond.
Here are four lessons that came out of this load testing experiment:
- Persistence is almost always the constraint. We sized every component to prod parity at the start: OpenSearch, Temporal’s frontend/ history/matching tiers, Cassandra. We watched all of them. Only one ever became the bottleneck: Cassandra CPU. OpenSearch sat at low double-digit CPU numbers during the entire test. Frontends barely flexed. History and matching tiers were comfortable. We had over-provisioned everything that wasn’t Cassandra. When you’re sizing a Temporal cluster, the persistence layer is almost always the constraint. Everything else exists to feed it. Spend your sizing budget there first.
- RF=3 with quorum beat RF=5. Our first iterations ran at replication factor 5 for more replicas, more durability, and more confidence. But Cassandra was pegged. As a diagnostic, we dropped to RF=3, and throughput nearly tripled. Half of our Cassandra CPU had been spent replicating writes to extra nodes we didn’t strictly need.
That trade-off fits our workload. Most of our workflows are ephemeral, completing in minutes and aging out of history, so the blast radius of a dropped one is small. Three replicas with quorum reads and writes still gives Temporal the durability and availability it needs. When we need more headroom, the lever isn’t a higher RF — it’s more nodes in the ring. RF=5 was paying for durability we didn’t need with throughput we did, so we’re shipping at RF=3. - Scale partitions with the matching tier. Once Cassandra stopped being the bottleneck, a different one appeared: one matching pod running hot while the others sat near-idle. This is a classic Temporal symptom. The default numTaskqueueReadPartitions is 16, and we had more matching pods than that, so sixteen partitions couldn’t spread evenly across our consumers. We bumped it to 32 and the hotspot vanished.
- Size for 3× peak, not peak. With the right Cassandra sizing and RF=3, the cluster sustained roughly 3× our peak production state-transition rate, with CPU comfortably below saturation. That’s exactly the headroom we wanted. Sustained-equals-peak isn’t enough because bursts will eat you. Once a Temporal queue starts growing, it does so faster than you can scale out of it.
What’s next
We’re in the middle of consolidating onto the new Cassandra-backed cluster. The realtime split stays for now. It’s load-bearing for our realtime SLOs and we don’t want to combine it with everything else mid-migration. Once the consolidation lands, we’ll retire the Aurora-backed Temporal cluster.
Two things are on our list to look at next. First, persistence p99 spikes correlate with Cassandra compaction events, so compaction tuning is the natural next step. Second, the node class we’re using is fine, but newer families with local NVMe may give us a better dollar-per-state-transition. Both are optimizations, though — the migration itself remains the priority.
Takeaways from the migration
Here are three takeaways we’d share with our former selves about managing our workflows:
- Postgres can carry self-hosted Temporal further than you’d think, if you tune for the workload. The Aurora parameter changes we covered above aren’t exotic. They’re a safe bet because of how Temporal uses the database. The same changes on a different workload could be a disaster.
- The right backend at scale is the one built for the workload. Temporal is sharded and write-heavy. Cassandra is built for sharded, write-heavy. Postgres bought us time; Cassandra bought us a curve.
- Load test until something hurts. Don’t size from spreadsheets. Stand up the cluster, point real workers at it, and watch what breaks. The dials that matter will be fewer than you guess; the ones you over-provisioned will be obvious.
We’re confident we’ll have more lessons to share after our consolidation on the new cluster. Follow us on Linkedin and Twitter to stay in the loop.
If building systems like this excites you, we’re always looking for talented engineers to join us at Quo. Check out our Careers page or reach out to connect!